


Theory of Constraints (TOC): The Complete Practitioner Guide to Finding the One Thing That Limits Your System
By Allan Ung | Founder & Principal Consultant, Operational Excellence Consulting (OEC)
Published: 04 October 2026

Allan Ung is the Founder and Principal Consultant of Operational Excellence Consulting (OEC), a Singapore-based management training and consulting firm established in 2009. With over 30 years of experience, including senior roles at IBM, Microsoft, and Underwriters Laboratories (UL), Allan has woven Theory of Constraints thinking into Value Stream Mapping programmes for Micron and Temasek Polytechnic, and into Lean Business Simulations for UL teams in Japan, Korea, and China.
He holds a Bachelor of Engineering (Mechanical) from the National University of Singapore and completed consultancy training in Japan as a Colombo Plan Scholar. Allan is a Certified Management Consultant (Japan), a Certified Lean Six Sigma Black Belt, and an accredited TPM Instructor.
Every plant, office, and project has one step that decides how much it can deliver. Improve anywhere else and the result never reaches the customer. This guide shows how I use the Theory of Constraints to find that step on the value stream map, protect it, and aim Lean's tools at it first.
I have never been engaged to run a Theory of Constraints project. No client has called OEC and asked for TOC by name, and I would be inventing a case study if I told you otherwise. What I have done, many times, is bring TOC into a Lean programme at the point where the programme needed it. The reason has been the same each time.
The organisations I work with already know Lean. They have run 5S, held kaizen events, learned the eight wastes, and drawn value stream maps. Then I ask a simple question: has output gone up in proportion to the number of improvements completed? When the honest answer is no, the cause is rarely effort. The work was real and the improvements were real, but they landed on resources that were never going to change what the customer received, so the shipment numbers stayed where they were.
The Theory of Constraints, developed by Eliyahu Goldratt and popularised by his 1984 novel The Goal, starts from a premise that Lean teams find uncomfortable at first. Every system has at least one constraint that limits how much it can deliver, and improving anything else is tidying. Lean asks where the waste is. TOC asks which waste is worth removing first, and its answer is blunt: the waste at the constraint.
This guide sets out how I use TOC in practice, which is by weaving it into Value Stream Mapping rather than running it as a separate programme. It covers the goal and the measures TOC uses, the Five Focusing Steps, Drum-Buffer-Rope scheduling, the way TOC and Lean tools work together, and the pitfalls that undo the gains. It is a spoke article in OEC's Lean Thinking cluster, and it builds directly on the Value Stream Mapping (VSM) practitioner guide, so start there if you have not yet mapped a value stream. The cluster hub is Lean Thinking: The Complete Practitioner Guide to Eliminating Waste and Creating Value.
🛠️ Teach the Constraint Mindset to Your Own Team The 101-slide facilitation-ready deck behind this guide: eight modules, eight team exercises, and case vignettes covering the Five Focusing Steps, throughput accounting, Drum-Buffer-Rope, buffer management, and a 30-60-90 day action plan. 👉 Download the Theory of Constraints (TOC) Fundamentals Training Presentation & Toolkit Here |
Busy Is Not the Same as Productive
Goldratt opened The Goal with a plant that looked efficient on paper and shipped late in practice. Alex Rogo, plant manager of UniCo's Bearington facility, had three months to turn it around. Robots and a new NCX-10 machine had lifted local efficiency in several departments. Inventory still piled up, orders still shipped late, and customers were still angry. The plant was not short of effort or technology. It was short of focus on the one or two resources that set the pace for everything else. Goldratt gave those resources a nickname that has stayed with practitioners ever since: Herbie.
The nickname comes from a Scout troop hike in the same novel. The boys walk in a single line, the fast ones race ahead, and the line stretches. The gap in front of the slowest boy grows by the minute, and that gap is inventory. Making the fast boys faster does nothing to bring the troop to camp sooner, because the troop arrives when Herbie arrives. The fix is to put Herbie at the front, lighten his load, and let everyone else keep pace with him. I use that story in workshops because it needs no jargon and no plant visit. Anyone who has queued behind one slow counter understands it.
Now translate the hike into a five-step process. Cutting is 92% busy, milling 88%, grinding 90%, and assembly 85%, while heat treatment sets the limit for the whole chain. Most management systems reward the first four numbers. Supervisors are praised for high utilisation, departments are measured on local efficiency, and nobody is thanked for letting a machine sit idle. The outcome is exactly what the hike shows: work piles up in front of the weak link, lead times stretch, and expediting becomes a permanent job. Utilisation of a non-constraint produces one thing, and it is inventory.
Goldratt's answer was to restate the goal of the business in terms that no local measure can satisfy by itself: make money now and in the future. Net profit, return on investment, and cash flow all have to rise together. A saving that moves none of the three is not an improvement, however good it looks on a departmental scorecard. The sentence is easy to agree with and hard to live by, because the departmental scorecards are still on the wall.
Three Measures and One Decision Rule
Goldratt replaced the thicket of cost-world ratios with three measures. Throughput is the rate at which the system generates money through sales, calculated as sales revenue less truly variable costs such as raw materials. Inventory is the money the system invests in things it intends to sell: raw material, work-in-process, finished goods, and the equipment itself. Operating expense is the money spent turning inventory into throughput, including wages, utilities, depreciation, rent, and overheads. Net profit is throughput minus operating expense, and return on investment is that difference divided by inventory. Every decision on the floor can be tested against those three numbers.
The order of attention matters. Raise throughput first, reduce inventory second, control operating expense third. This reverses the instinct of most cost-cutting programmes, and the reason is arithmetic. Cutting expense can only take you to zero, while growing throughput has no such ceiling. TOC does not ignore cost. It changes the order in which cost is allowed to drive decisions.
Throughput accounting shows what the reversal does to a real decision. The example below comes from OEC's training material and is illustrative, but the logic is not. A heat-treat oven has 480 minutes a day. Product A sells for $100 with $40 of materials, so it yields $60 of throughput and uses 30 oven minutes, or $2.00 per oven minute. Product B sells for $75 with $30 of materials, so it yields $45 and uses 15 minutes, or $3.00 per oven minute. A cost-world accountant ranks A first because its unit margin is higher. Run the oven all day on A and you make 16 units for $960. Run it on B and you make 32 units for $1,440, which is half again as much money from the same oven on the same day. Products at the constraint should be ranked by throughput per constraint minute, not by unit margin.
Two sentences from The Goal carry the rest of the philosophy. An hour lost at the bottleneck is an hour lost for the entire system, and an hour saved at a non-bottleneck is a mirage. The first tells you where to put your best people, your maintenance effort, and your attention. The second tells you to stop celebrating utilisation gains and headcount savings at resources that were never limiting output. Spare capacity at a non-constraint is normal and healthy. Use it for setups, quality checks, and training.
Dependency, Fluctuation, and the Four Places a Constraint Hides
Why does a line that looks balanced still lose output? Two facts of process life are responsible, and they compound each other. Steps depend on each other, so a station cannot start until the previous one delivers and downstream output can never exceed what upstream provides. And every step varies: cycle times, breakdowns, and demand all move around their averages. In a chain of dependent steps, delays accumulate and gains do not. A late delivery starves the next station, while an early one simply waits. Averages hide the damage, which is why a plant can report high average utilisation on every resource and still miss its ship dates. The goal is not a balanced line. The goal is protection at the one place where lost time cannot be recovered.
Teams argue about definitions before they find anything, so I fix the vocabulary early. A bottleneck is a resource whose capacity is below the demand placed on it, and it always has a queue in front. A capacity-constrained resource has capacity only slightly above demand, and it becomes a bottleneck when the product mix changes or the machine breaks down. The system constraint is the broader idea: anything that stops the system achieving more of its goal. Every system has at least one, and it does not have to be a machine.
I teach four places where a constraint can hide. It may be physical: a machine, a workcentre, a skilled person, or floor space. It may be the market, when the plant can make more than customers order. It may be supply, where unreliable vendors or long lead times limit what can be built. Or it may be a policy, such as a batch-size rule, an efficiency target, or an approval limit. Policy constraints are the hardest to see, and Lean teams walk past them more often than any other kind because they look like ordinary management. They are also the cheapest to break. A policy is a constraint we chose, which means it can be unchosen without capital.
Finding the Constraint on the Value Stream Map
This is where my own practice sits, and I should be plain about how it works. I do not run TOC as a standalone programme. When a client team builds a current-state map in one of our VSM workshops, I add a question once the data is on the wall: where is the constraint, the drum that sets the pace for everything else?
The VSM guide treats takt time as the reference point for every step, and a step running slower than takt creates a bottleneck. TOC picks up from there. We add capacity per day beside each cycle time, put the daily demand beside it, and divide. Load above 100% of capacity marks a resource that cannot meet demand, and anything above about 85% deserves watching as a possible capacity-constrained resource. An illustrative machining plant makes the arithmetic plain. With demand at 100 units a day, the loads come out as follows.
Resource | Daily capacity (units) | Load at 100 units a day |
Cutting | 140 | 71% |
Milling | 120 | 83% |
Heat Treat | 90 | 111% |
Grinding | 115 | 87% |
Assembly | 130 | 77% |
Illustrative plant from OEC's TOC training material. Heat Treat caps the whole plant at 90 units a day, whatever the other resources achieve. Grinding, at 87%, deserves watching as a possible capacity-constrained resource.
Arithmetic alone does not convince a room, so we verify on the floor. The longest queue on the map is usually right in front of the constraint, and the stations after it starve and then rush when parts arrive. Expediting concentrates in the same place, because overtime, hot lists, and "where is my order?" calls all point there. I ask the expeditors and the schedulers where the constraint is, since they already know. If the numbers, the queue, and the expediting agree, we have our drum. If they disagree, we have not found it yet and the team keeps looking.

With the drum identified, the kaizen projects on the future-state map are chosen around it, and the aim is to exploit the bottleneck before anything else. At Micron, the Assembly, Test, and Module value streams were examined this way; the engagement itself is described in the VSM guide. At Temasek Polytechnic the value stream was administrative, and the queue was requests and files rather than pallets, but the logic was identical. Which kaizen projects came first was decided by what they would do for the constraint.
I will not attribute Micron's US$1 million of additional opportunities to TOC. That figure came from the mapping as a whole. What TOC contributed was a ranking: a reason to start with the projects around the bottleneck, and a test for the ones that could wait.
What Stickle Bricks Taught Our Teams at UL
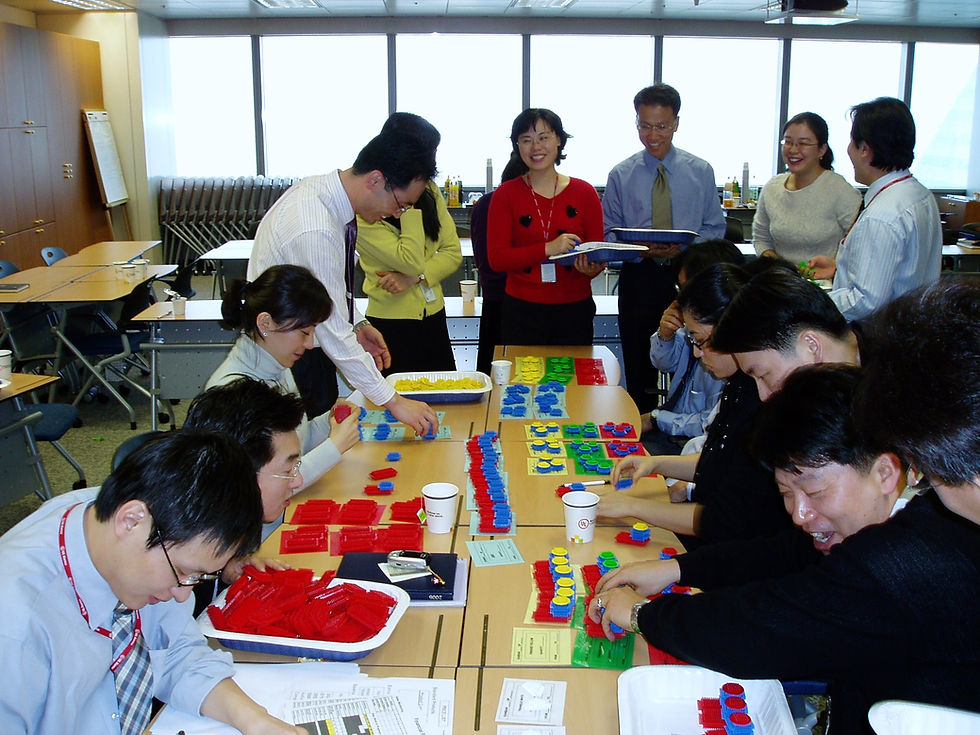
During my years with Underwriters Laboratories, I ran Lean Business Simulations for teams at UL facilities in Japan, Korea, and China. The simulation is deliberately simple. Participants build product from coloured stickle bricks, pass it through a sequence of process steps, and work through several rounds in which they change how they operate. I do not tell them where the constraint is. I ask them to find where work waits, count it, and decide what to do about it.
In these sessions the constraint has typically turned up at the Final Review process. That is a revealing place for it to land. Final Review is the step every unit must pass, so whatever builds up behind it is waiting for it, and the natural instinct to speed up the earlier steps only enlarges the pile. A lecture about Herbie can be nodded at and forgotten. A table of colleagues counting the queue in front of their own Final Review, and then arguing about what to do with it, will not forget.
That is why I keep the simulation in the programme. Participants discover the constraint instead of being told about it, and the vocabulary of queue, drum, and exploit enters the room as theirs.
The Five Focusing Steps
Goldratt's improvement cycle has five steps, and the order is the discipline. The first three cost little or nothing. Money is spent only at step four, and only if the first three have been squeezed dry.
Step 1: Identify the Constraint
Step one is what the previous section described: queues that build in front of one resource week after week, downstream stations that starve and then rush, expediting that concentrates in one place, and load above capacity on paper. You seldom need a study. Walk the floor, ask the schedulers, and test the answer with numbers.
Step 2: Exploit the Constraint
Exploiting means getting every possible unit from the constraint with what you already have, and it needs no capital. That makes it the natural home of the kaizen team. Six disciplines apply. Never starve the constraint: keep a cushion of work in front of it so it never waits for parts. Keep it running by staggering breaks, lunches, and shift changes so it never idles. Do not waste it: inspect before the constraint and never process a defective part, because a scrapped part there is throughput lost for good. Run the right work only, ranked by throughput per constraint minute. Cut its setups by applying SMED here first, since every minute saved is a minute sold. And offload what you can to non-constraints or alternative routings. The rule I give teams is short: never buy capacity for a constraint you are still wasting.
Step 3: Subordinate Everything Else
Subordination is the hardest step because it asks non-constraints to look inefficient so that the whole plant looks better. Operators at a non-constraint will be idle for part of the shift, and that is correct. Material is released at the pace the constraint can consume it, and the schedules of every other resource follow from the constraint's schedule. None of this survives unless policies and measures change with it. If the efficiency targets stay on the scorecard, the old behaviour returns within weeks.
Step 4: Elevate the Constraint
Only when exploitation and subordination are exhausted do you add capacity, whether through people, equipment, shifts, or outsourcing. Teams reach for this step first because it feels like progress, and it is the step that spends money. OEC's training material follows an illustrative machining plant, Precision Parts, through the cycle. After eight weeks of applying the first three steps at the heat-treat oven, output rises from 90 to 100 units a day, which meets demand, with no capital spent. Work-in-process falls by 35% and on-time delivery climbs from 72% to 96%. Those figures are illustrative and show the pattern, not a promise. In that plant, elevation was never needed.
Step 5: Go Back
When a constraint breaks, another appears, and inertia becomes the next constraint if the team stops looking. Suppose the oven in the illustrative plant were elevated from 90 to 125 units a day. Cutting, milling, grinding, and assembly all exceed 100, and the weakest link is now the market at 100 units a day. The task changes from manufacturing improvement to selling more or breaking a policy. The cycle never ends, which is why I recommend a quarterly Step 5 check on every constraint review calendar.
Drum-Buffer-Rope: Making Exploit and Subordinate a Daily Routine
Steps two and three need a working mechanism, or they remain slogans on a wall. Drum-Buffer-Rope (DBR) is that mechanism. The drum is a realistic schedule for the constraint that sets the beat for the whole plant. The buffer is a time cushion that protects the constraint from whatever goes wrong upstream. The rope is the signal that releases material into the plant only when the drum needs it.

Only the constraint gets a detailed schedule. It is loaded realistically, including planned maintenance and changeovers, and jobs are sequenced by due date with similar work grouped to save setup time. The scheduler confirms that material is due before the job is scheduled, because an idle constraint is lost throughput. Non-constraints need no detailed schedule at all. They work on what arrives, in order. One schedule replaces dozens of local ones, and that alone removes a great deal of daily argument.
The buffer protects with time, not stock. Three buffers do the work: a constraint buffer, so that work due at the drum is released early enough that the drum never waits; a shipping buffer, so that finished work waits before the promise date rather than after it; and an assembly buffer, so that non-constraint parts arrive ahead of the constraint parts they join. Time buffers protect throughput with far less inventory than blanket stock buffers.
The rope works backwards from the customer. Start from the due date, subtract the shipping buffer to find when the drum must process the job, then subtract the constraint buffer to find the material release date. Nothing enters the plant earlier. Release control is the cheapest way I know to cut work-in-process and lead time, because it costs a policy decision and no machinery. In the illustrative plant, releasing material to the oven's pace takes order lead time from 12 days to 8.
Sizing the first buffers does not need a study. Take today's typical lead time, halve it, and split the total between the constraint buffer and the shipping buffer. A lead time of 12 days gives a starting buffer of 6 days, or 3 plus 3. Then tune from experience, because a buffer is adjusted by what its status shows and not calculated once.
The status is shown in three colours. Split the buffer into thirds. A job that has used up to 33% of its buffer time is green: it is on its way, and nobody should chase it. Between 33% and 67% it is yellow: locate the job and prepare a recovery plan, but do not expedite yet. Beyond 67% it is red, and the constraint or the customer is at risk, so expedite now. A buffer hole is a job that should have reached the buffer and has not. Most jobs never need chasing, and that is the point. The daily buffer meeting looks at red and yellow only, and every red job has its cause logged. The log of delay causes becomes the improvement agenda, which feeds Step 5 and gives the kaizen team its next list of targets. This is the same visual management logic I describe in the Visual Management practitioner guide and the Lean Daily Management System guide: a board that everyone can read in ten seconds, and a short meeting that acts on it.
A word on kanban, since Lean teams ask. Both kanban and DBR are pull, and they differ in where the signal comes from. Kanban signals between steps, while DBR releases material from the constraint. Many plants use both: kanban on repetitive lines, DBR where a real constraint drives the mix. The Lean Production System guide covers kanban in depth.
TOC and Lean: Where to Aim, and How to Hit It
TOC does not replace Lean. The two share ground on flow, customer value, and continuous improvement, and they differ in the first question they ask. Lean asks where the waste is, and encourages removing it everywhere. TOC asks which resource limits the system, and prioritises by throughput impact. Used together, Lean removes waste while TOC decides which waste is worth removing first. You do not need new tools. You need to point the ones you have at the constraint.
The value stream map comes first, as described above. It shows where work waits, and capacity data turns the map into a constraint finder. Then the rest of the Lean toolbox follows in a particular order.
Every workstation deserves 5S, but the constraint deserves it first and deepest: no searching for tools, no clutter, no delay at the one place where lost minutes are lost for good. The 5S implementation guide sets out the method. Kaizen events belong at the constraint too, aimed at its downtime, changeovers, quality, and waiting for parts, as set out in the Kaizen practitioner guide. A kaizen event on a non-constraint can look excellent and deliver no extra shipments. OEC's training material has an illustrative plant that learns this the expensive way: earlier events at grinding and milling produced no gain at all, because neither was the constraint. When the team redirected 5S, SMED, and a TPM cleaning routine to the heat-treat oven, oven changeover time fell by 40%. Same tools, same people, different target.
Standard Work belongs at the constraint first, so that every shift achieves the same output from the one resource whose output counts. TPM protects the drum. A breakdown at the constraint stops the plant, which is why autonomous maintenance and planned care matter most there; the TPM practitioner guide and the Planned Maintenance guide cover the system. Track OEE on every machine if you wish, but improve it at the constraint first, because a point of OEE there is a point of plant throughput.
Six Sigma project selection changes as well. Choose projects by their effect on the constraint, not by the size of the defect rate. A defect before the constraint means it may wait for a replacement part. A scrapped part at the constraint is throughput lost forever. A defect after the constraint wastes constraint time already spent. Rank DMAIC projects by that logic, and a project on final inspection may well outrank one on a department with a worse yield.
The advice I give Lean teams is short: do not do less Lean, do it in the right order.
Beyond the Shop Floor
The five steps work wherever work flows through dependent steps. A quote-to-cash process has a constraint, and it is usually one approver or one team where requests wait. Exploit it by completing the file before it reaches the approver. Subordinate by having everyone else route and prepare work at the approver's rhythm. Elevate by adding a second approver or delegating authority. Then go back, and expect the next queue to appear, often as a sign-off policy. This is the same logic as the administrative value stream we mapped at Temasek Polytechnic, and it is why the Lean Six Sigma for Service and Administration guide pairs well with this one.
TOC also reaches into supply chains, where it replaces forecast-driven pushes with replenishment by actual consumption, holding stock centrally and shipping small quantities often. It reaches into projects, where Goldratt's Critical Chain names the habits behind late delivery: padded task estimates, late starts that burn the safety, multitasking that stretches every task, and delays that are passed on while gains are not. The remedy is one project buffer in place of hidden padding, no multitasking on the critical chain, and a fever chart that reads the buffer by zone, using the same green, yellow, and red as the shop floor.
For policy constraints, Goldratt offered five logic tools: the Current Reality Tree, the Evaporating Cloud, the Future Reality Tree, the Prerequisite Tree, and the Transition Tree. I teach them for awareness, and I would be misleading you if I said they are the first thing a Lean team needs. The Five Focusing Steps and Drum-Buffer-Rope come first. The Evaporating Cloud earns its place when two policies fight each other. The illustrative case in OEC's material is a rule that runs the oven only on full-furnace batches to save changeovers, so small orders wait days for a full load. The cloud exposes the assumption that changeovers are too slow for small loads, SMED breaks it, and the constraint, which had moved from a machine to a rule, is resolved with a setup workshop and no new furnace.
Where TOC Deployments Go Wrong
The gap between the textbook and the shop floor is wide, and I would rather name it than hide it. In the textbook, the constraint holds still. On a real floor with a changing product mix, it can appear to wander. When the bottleneck seems to move every week, the cause is usually one of two things: the mix is changing, or material is being released too fast, which is a failure of subordination. Both are solvable, and neither is a reason to abandon the method.
Of the pitfalls I warn about, two do more damage than any machine problem. The first is leaving the old measures in place. Behaviour follows measurement, and if efficiency targets and big-batch bonuses survive the new schedule, the schedule loses. The table below shows the pairs I walk teams through.
Area | Measure that undoes the gain | Measure that protects it |
Production | Efficiency of every work centre | Throughput of the whole plant |
Machines | Utilisation of every machine | Uptime and OEE at the constraint |
Purchasing | Lowest purchase-price variance | Right material on time, every time |
Bonuses | Reward for big batches | Reward for on-time delivery |
Progress | Busy operators everywhere | Buffer status: green, yellow, red |
The second is the lack of subordination. Non-constraints keep running flat out because idle operators feel wrong, and the work-in-process builds again. Beyond these two, the list is short and consistent. Buffers cut too early starve the constraint, while buffers left too big hide problems and lengthen lead time. Expediting yellow jobs adds noise, and ignoring the log means the same delays repeat. Nobody owns the constraint. And the team declares victory after the first gain and never runs Step 5 again.
OEC's training material tells the story of a plant that slipped back, in an illustrative case. Six months after the gains, the efficiency bonus returned to the non-constraint work centres, operators ran big batches again to hit their targets, the oven owner moved to another site and nobody took over, and the daily buffer meeting faded and then stopped. On-time delivery fell from 96% to 81%. The figures are illustrative; the pattern is real, and I have no wish to claim more for it than that. Measures and ownership decide whether gains last.
Leading TOC: Owners, Measures, and Rhythm
TOC is a management method before it is a shop-floor method, because the machines rarely block it. Rules, measures, and attention do, and only management can change them. The executive sponsor does not run the constraint. The sponsor makes it possible to run it well, by naming one owner with authority across shifts and functions, replacing local efficiency targets with throughput and on-time delivery, removing the policies that block the team (batch rules, bonus schemes, purchasing terms), attending the weekly constraint review, and recognising flow rather than busy machines. A sponsor who skips the weekly review teaches the plant that TOC is optional.
Four roles keep the practice alive after the workshop ends. The constraint owner answers for the constraint and its daily output. The buffer manager runs the daily buffer meeting, chases red orders, and records the reason for each delay. The TOC champion coaches the teams and links the method to Lean and Six Sigma work. And a cross-functional team of operations, planning, maintenance, quality, sales, and finance works the constraint together. Name the people before you choose the tools.
A rhythm of reviews turns a project into a way of managing. The buffer meeting runs daily, as a short stand-up on red and yellow orders. The constraint review runs weekly on load, downtime, and reasons for delay. Leadership reviews measures and policy obstacles monthly, and the quarterly Step 5 check asks whether the constraint has moved and resets buffers and targets. A one-page dashboard of throughput, inventory, and operating expense completes the picture, and local efficiency stays off it. The Lean Daily Management System guide shows how these tiers connect.
I recommend a staged start: prepare, pilot, extend, sustain. Prepare means winning a sponsor, naming the team, and training the managers who will have to change the rules. The pilot is one line with a clear constraint, with throughput, inventory, and on-time delivery baselined first. Extend means rolling out to other lines, then to the policies in purchasing, sales, measures, and bonuses. Sustain means fixing the review cadence so the gains outlast the champion. A first ninety days for one line is enough to show results: diagnose in the first thirty days, act in the next thirty, and review against the baseline in the last thirty. People resist change they do not understand, so explain the why before the how. The questions are what to change, what to change to, and how to cause the change, and the Change Management practitioner guide addresses the human side in depth.
The Question to Ask Before Your Next Improvement Event
Return to the question I put at the start: has output risen in proportion to the improvements completed? An honest no is not a sign of a failed Lean programme. It is a sign that the programme has not yet asked where the system is limited. Lean teams rarely lack energy or projects. What they need is a way to rank those projects by what they would do for the customer.
So before the next kaizen event, 5S audit, or Six Sigma project is launched, put one question on the planning sheet: does this help the constraint, or does it only make someone look busy? If the answer is the second, the project can wait. Improvement rarely needs more effort. It needs the same effort at the one place that decides the result.
Build Constraint-Management Capability
Knowing the Five Focusing Steps and running them with a team are different skills. These OEC resources give you a structured way to build the second one.
Theory of Constraints (TOC) Fundamentals Training Presentation & Toolkit — the 100+ slide deck behind this guide, with eight team exercises, case vignettes, and a 30-60-90 day action plan.
Value Stream Mapping Training Presentation & Practitioner Toolkit — the mapping method that makes the constraint visible in the first place.
Value Stream Mapping (VSM) Training Course — a facilitated workshop in which your team maps its own value stream.
Lean Thinking Training Course — the foundation course, including business simulations that let teams discover constraints themselves.
About the Author

Allan Ung is the Founder and Principal Consultant of Operational Excellence Consulting (OEC), a management training and consulting firm he established in Singapore in 2009. He began his career as a consultant at Singapore's National Productivity Board (now Enterprise Singapore), where he pioneered Cost of Quality and Total Quality Process initiatives that enabled companies to reduce quality costs by up to 50 percent. He went on to senior regional and global roles at IBM, Microsoft, and Underwriters Laboratories (UL), where he led Lean deployment, quality system strengthening, and cross-border operational transformation, including the Lean Business Simulations he ran for UL teams in Japan, Korea, and China.
Allan holds a Bachelor of Engineering (Mechanical) from the National University of Singapore and completed advanced consultancy training in Japan as a Colombo Plan Scholar. He is a Certified Management Consultant (CMC, Japan), a Certified Lean Six Sigma Black Belt, a JIPM-certified TPM Instructor, a TWI Master Trainer, an ISO 9001 Lead Auditor, and a former Singapore Quality Award National Assessor.
He has facilitated Lean, Value Stream Mapping, and TPM programmes for organisations including Micron, Lam Research, Tokyo Electron, Panasonic, Temasek Polytechnic, Sika Group, Toyota Tsusho, BRC Weldmesh, and NileDutch, and he weaves Theory of Constraints principles into those programmes where the value stream calls for it.
His philosophy: "Manufacturing excellence is achieved through disciplined systems, capable leadership, and sustained execution on the shopfloor."
His practitioner-led toolkits have been used by managers and organisations across Asia, Europe, and North America to build Lean capability and drive organisational improvement.
👉 Learn more at: www.oeconsulting.com.sg
Further Learning Resources
This article is a spoke of OEC's Lean Thinking content cluster. These guides, decks, and courses cover the ground around it.
Hub article
Lean Thinking: The Complete Practitioner Guide to Eliminating Waste and Creating Value — the five principles, the eight wastes, and the Lean toolbox that TOC tells you where to aim.
Value Stream Mapping and Flow
Value Stream Mapping (VSM): The Complete Practitioner Guide to Seeing, Analysing, and Redesigning Your Processes — the four-phase mapping method behind the constraint analysis in this guide, with the Micron engagement.
Flow Engineering: A Practitioner's Guide to Closing the On-Ramp Gap — a lightweight mapping route to the constraint for digital and knowledge-work teams.
Mastering the Lean Production System: A Practitioner's Guide to Flow, Signaling, and Waste Elimination — kanban and pull signalling, to set beside Drum-Buffer-Rope.
Lean tools aimed at the constraint
5S implementation: A Practitioner's Guide to Building a Workplace that Works — start with the constraint workstation.
Kaizen: A Practitioner's Guide to Building a Culture of Continuous Improvement — run events where they raise throughput.
Standard Work: The Complete Practitioner Guide to Eliminating Process Variation and Sustaining Lean Gains — hold every shift to the same output at the drum.
Total Productive Maintenance (TPM): The Complete Practitioner Guide to Maximising Equipment Reliability — protect the constraint's uptime.
Planned Maintenance: A TPM Practitioner Guide to Building a Maintenance System That Actually Works — schedule maintenance around the drum.
Running it day to day
Visual Management: The Practitioner's Guide to Building a Workplace where Problems Cannot Hide — the thinking behind buffer boards.
Lean Daily Management System (LDMS): The Complete Practitioner Guide to Sustaining Lean Every Day — the daily and weekly review cadence that keeps the constraint on the agenda.
Lean Six Sigma for Service and Administration: The Complete Practitioner Guide — constraints in offices and approval chains.
Change Management: A Practitioner Guide to Leading Successful Organizational Change — for the leaders who must change the measures.
Training presentations and toolkits
Theory of Constraints (TOC) Fundamentals Training Presentation & Toolkit — the 101-slide deck behind this guide.
Value Stream Mapping Training Presentation & Practitioner Toolkit — map the stream and find the drum.
Total Productive Maintenance (TPM) Facilitator Toolkit — protect constraint equipment availability.
5S Workplace Organization Toolkit — visual management at the key work centres.
Lean Manufacturing Training Presentation & Implementation Toolkit — the wider Lean system that TOC focuses.
Visual Management Training Presentation & Practitioner Toolkit — the boards and signals for buffer status.
Lean Daily Management System Training Presentation — tier meetings and daily accountability.
Root Cause Analysis (RCA) Training Presentation — eliminate the causes behind red-zone buffer penetrations.
Flow Engineering Training Presentation & Practitioner Toolkit — the lightweight mapping route for knowledge-work teams.
👉 Browse the full library of facilitation-ready toolkits at www.oeconsulting.com.sg